Reports to monitor your recruitment strategy
Data is gold!
The use of reports in evaluating a recruitment strategy is crucial for several reasons. Here are some of the most important aspects:
- Measuring effectiveness: Reports allow you to track key performance indicators (KPIs) such as average time to hire, cost per hire, applications per job ratio, etc. This data helps measure the effectiveness of the various strategies used and identify areas that need improvement.
- Data-driven decision-making: In today's business world, making decisions based on intuition or assumptions is often not enough. Reports provide tangible data that can guide more informed and strategic decisions.
- Resource allocation: By understanding which recruitment methods yield the best results, recruitment firms can more effectively allocate their resources and budget, investing in the most successful strategies and adjusting or abandoning those that are less effective.
- Diversity and inclusion tracking: Reports can help track progress in recruiting candidates from diverse backgrounds, ensuring that the company meets its diversity and inclusion goals.
- Competitive analysis: Understanding how your recruitment methods compare to the competition can give you a competitive edge. Reports can provide insights into what other companies are doing and where you stand relative to them.
- Legal compliance: Reports also help ensure compliance with labor regulations and fair hiring standards. They serve as a record to prove that hiring practices comply with applicable laws.
- Return on Investment (ROI): Any business strategy requires an evaluation of return on investment. In recruitment, it's the same. You need to know if the time, money, and effort invested in different recruitment strategies are producing the desired results.
By using detailed reports, a recruiter can not only prove the value of their work to current management but also continuously refine their methods to adapt to labor market changes and company objectives.
If you are a client of our recruitment solution Nicoka CABS (ATS dedicated to recruitment firms), you have several native reports to closely monitor your recruitment strategy, and you can also create your custom reports.
Across all your missions
Performance Analysis
What?
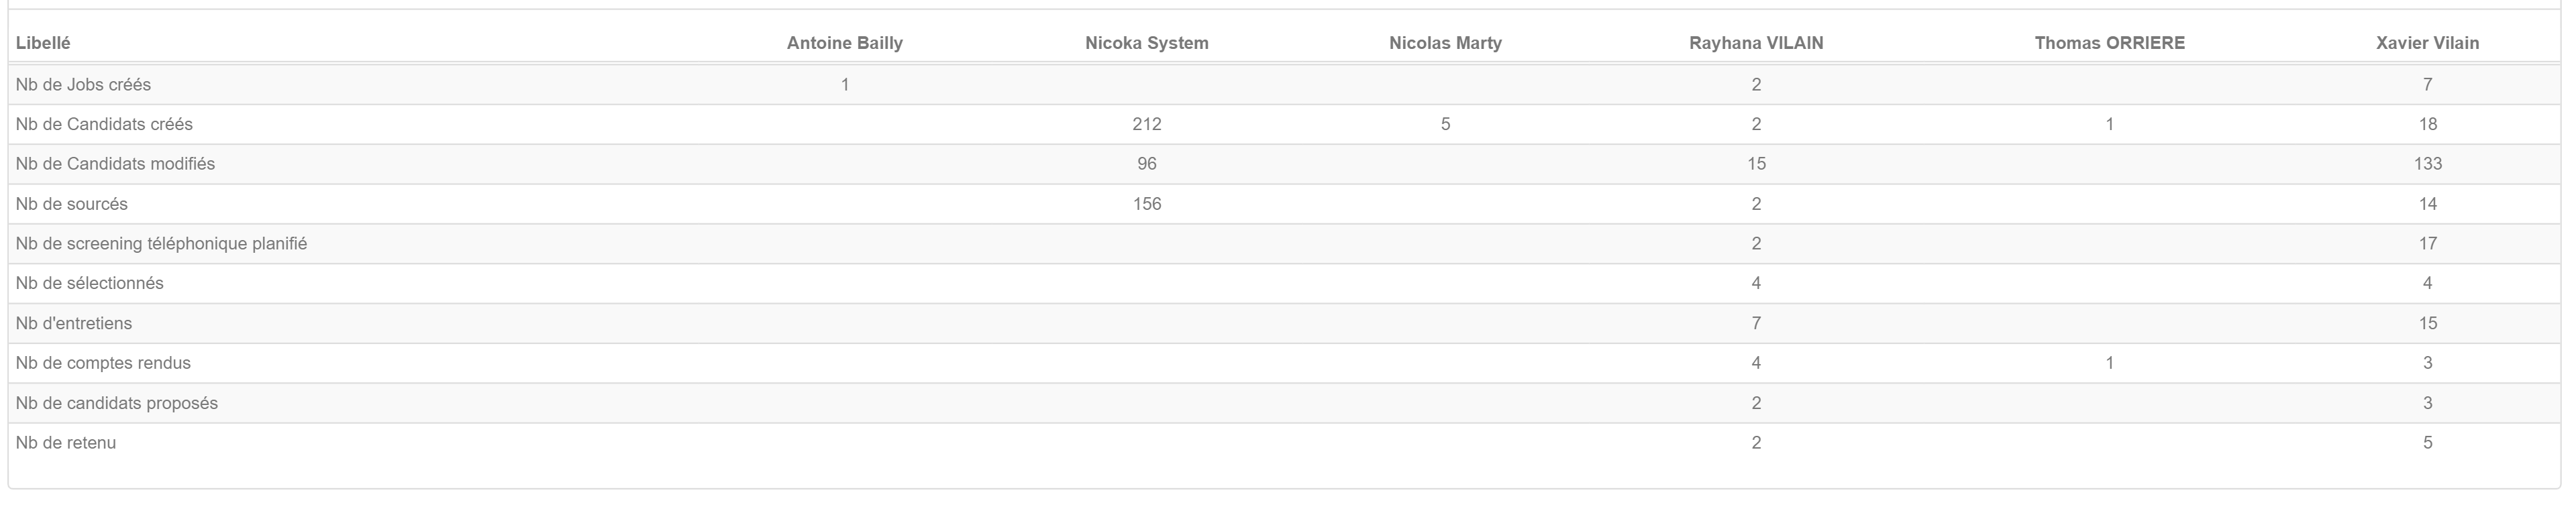
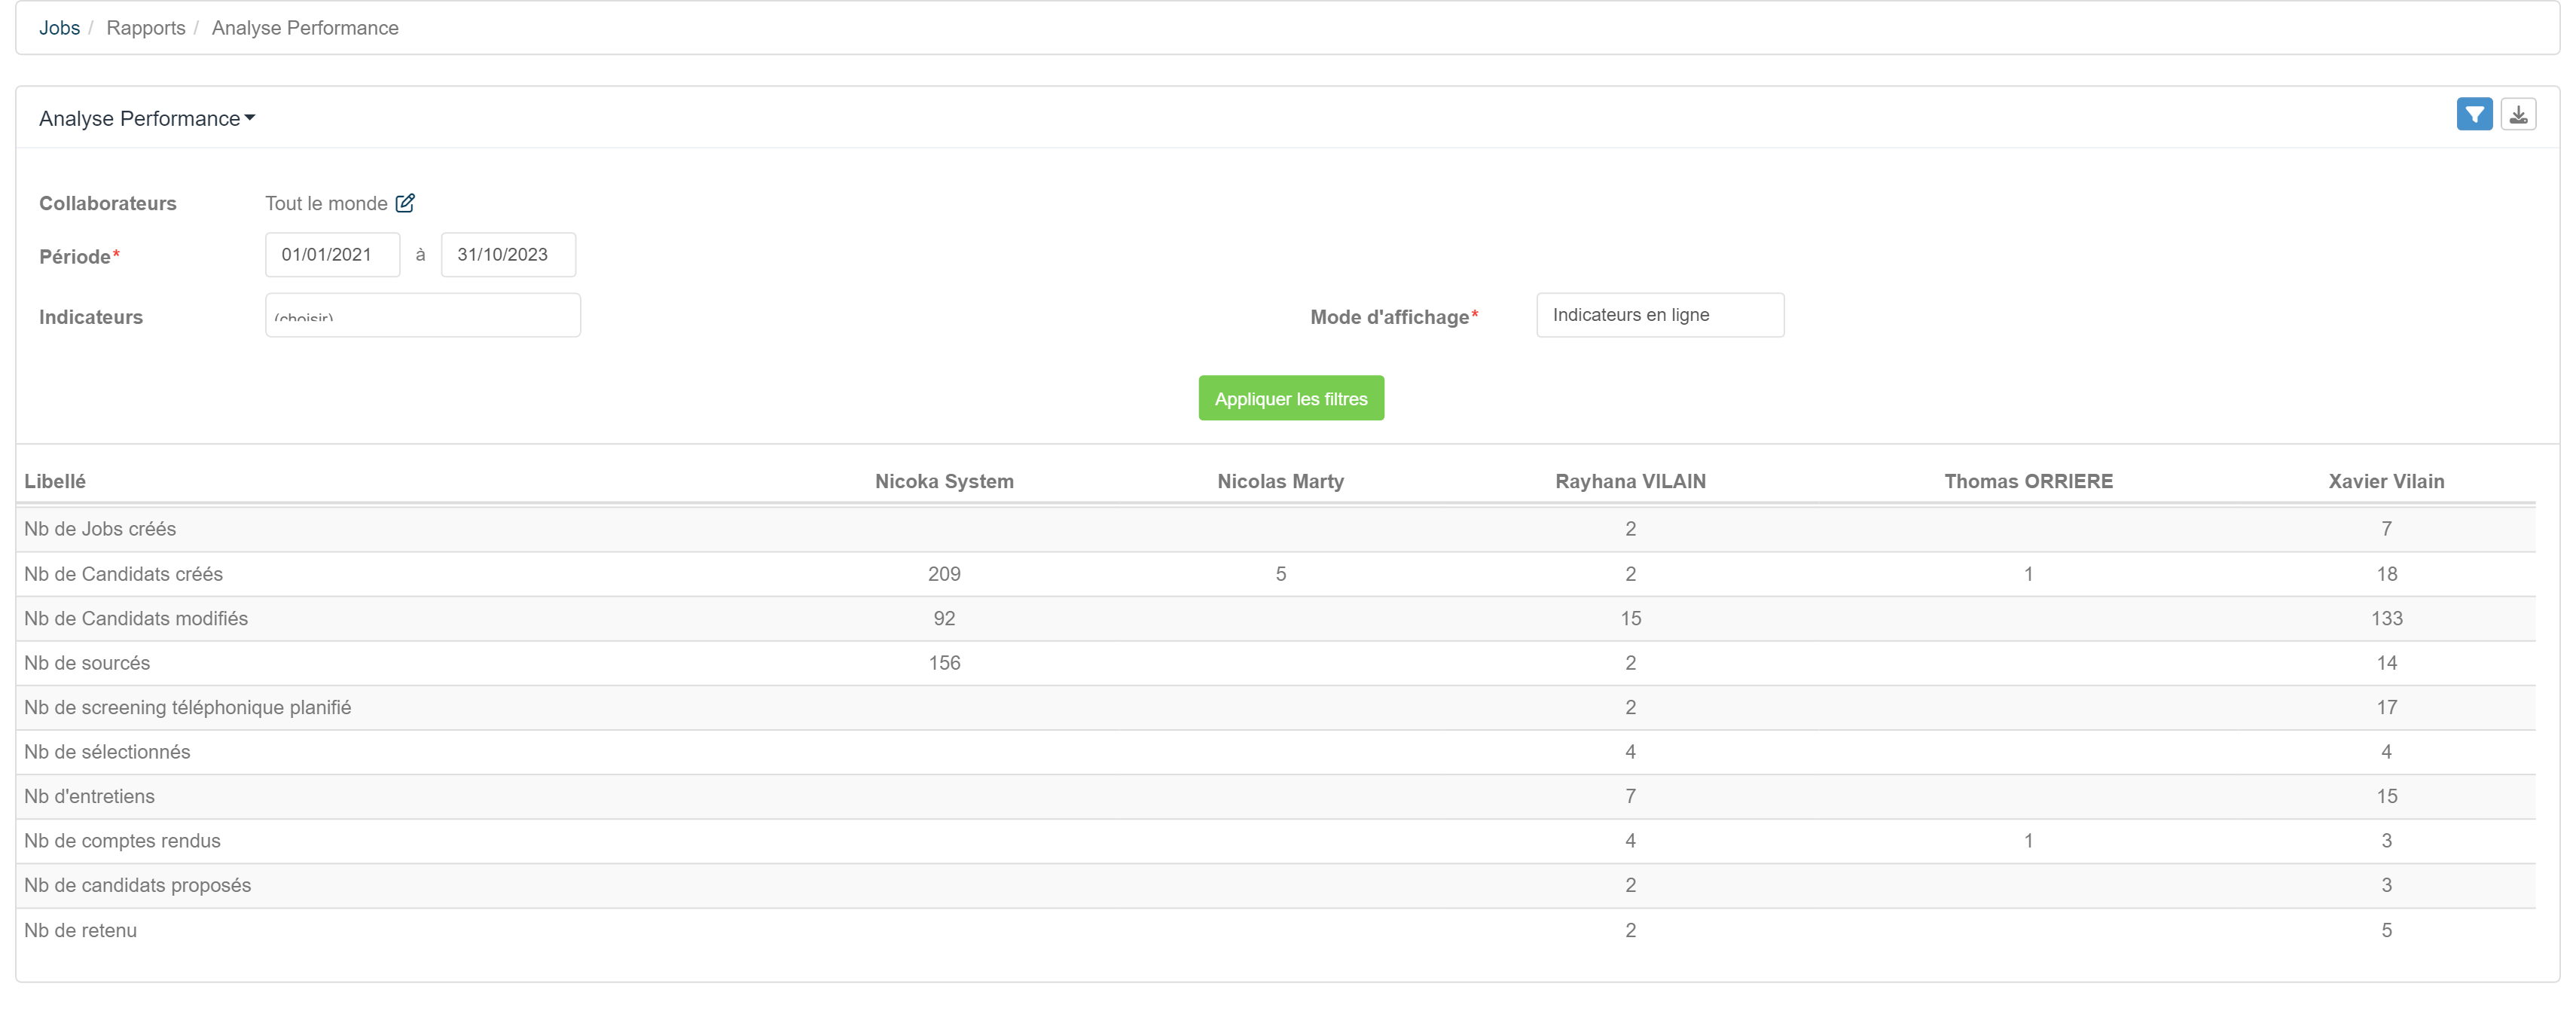
This report allows you to have visibility into each recruiter's activity over a chosen period and in connection with your recruitment process.
How?
The Performance Analysis report allows you to see on a single screen and for each of your employees
- The number of missions created
- The number of candidates created
- The number of candidates modified
- The number of candidates who progressed through each stage of your recruitment process: applications, pre-qualification, selected, interview, CV sent, offer, hired, ...)
Configuration
You have the option to filter by
- Employees
- Period
- Indicators
- Add variants to save your filters
You can
- Invert the table to have indicators in rows or columns according to your needs
- Download the table in Excel format
Annual Global Analysis
What?
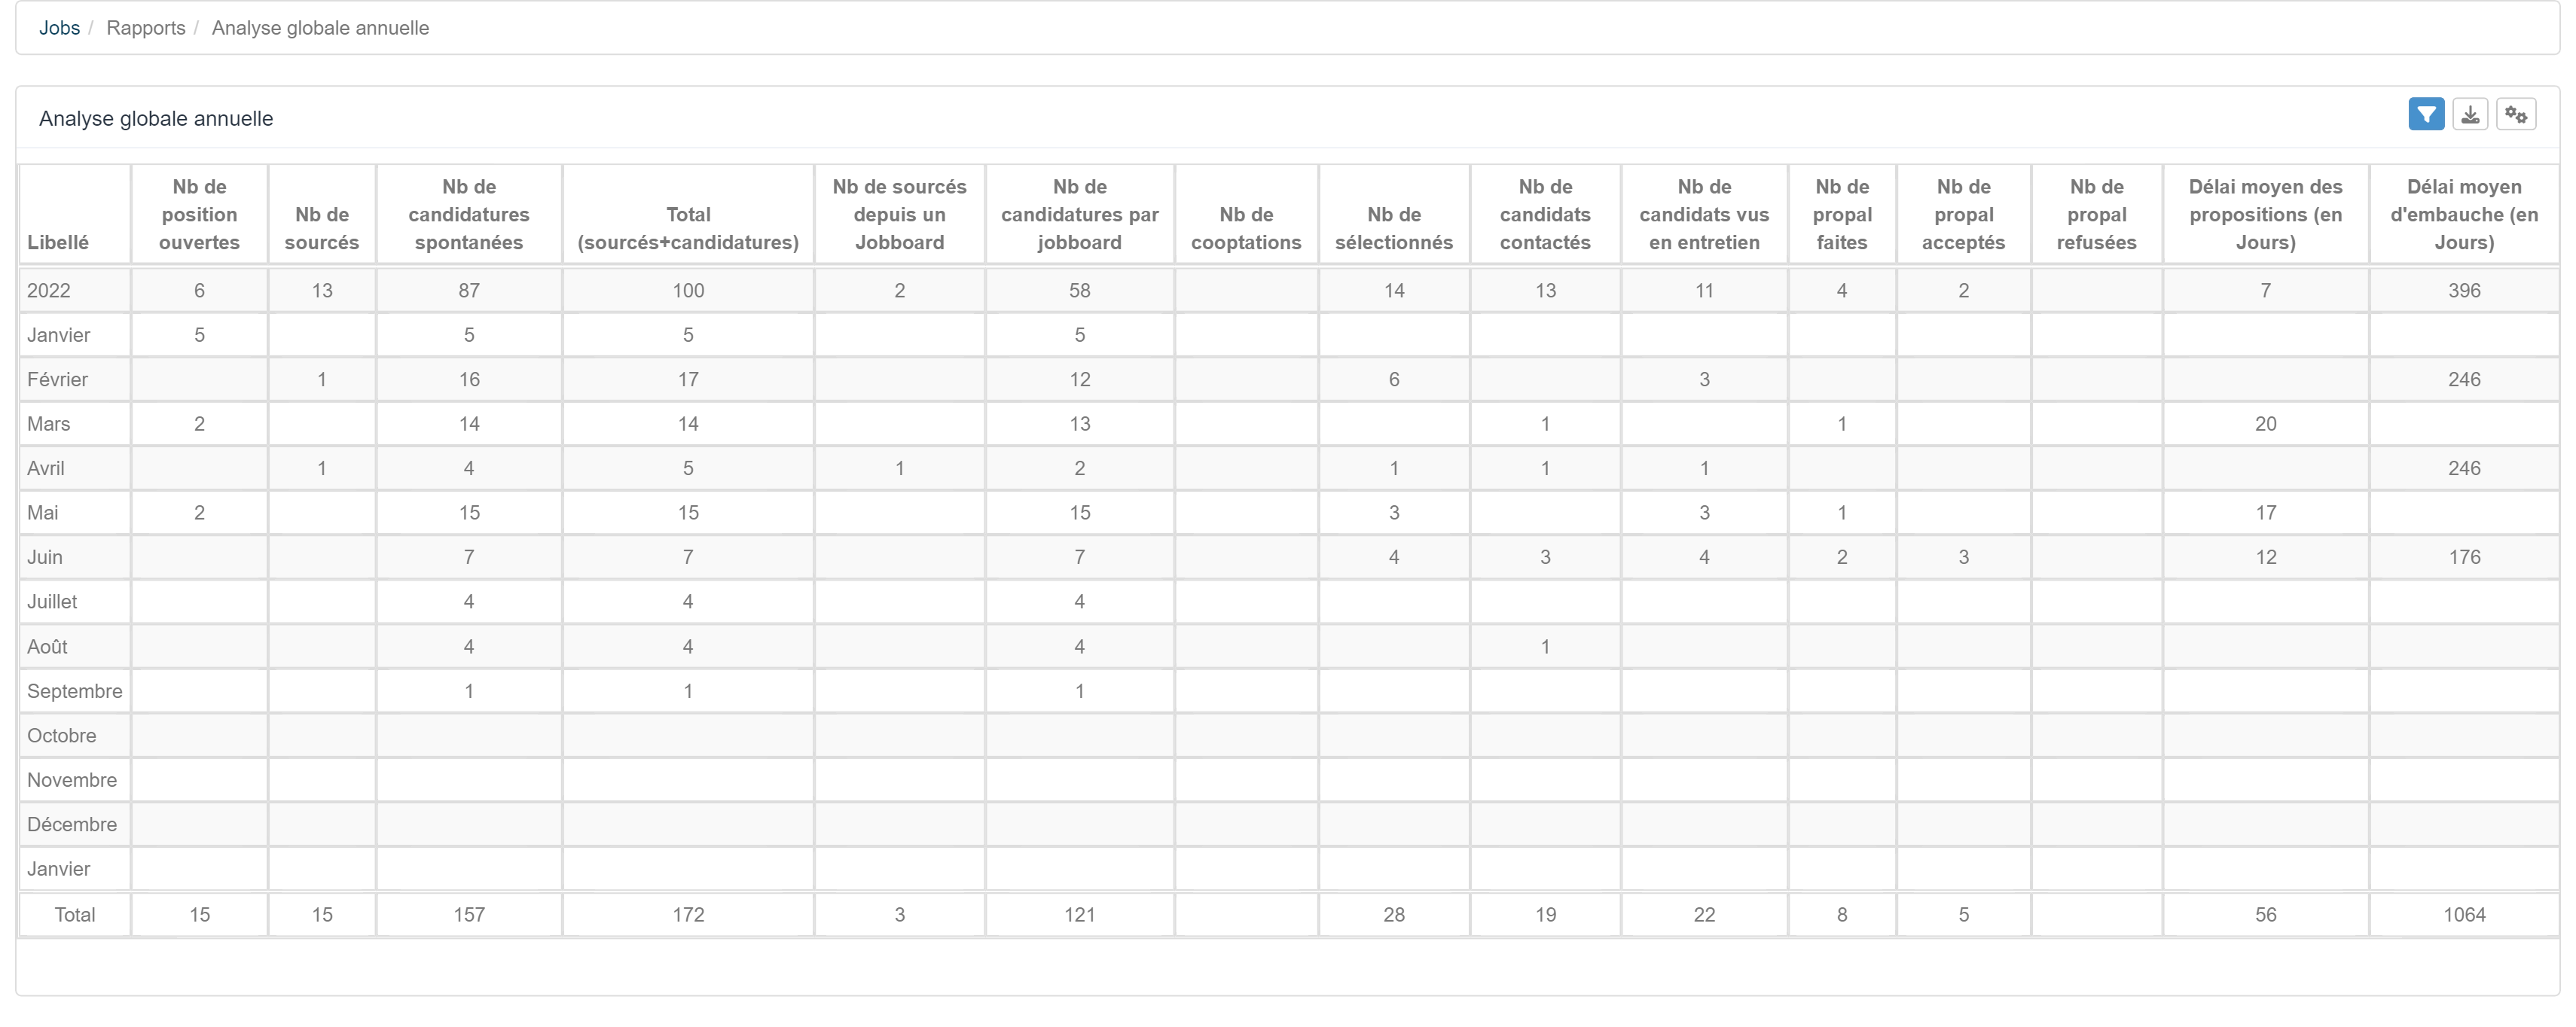
This report gives you an extremely detailed view of your recruiters' activities (overall and for each) over a chosen period and in connection with your recruitment process.
It is partly the same report as the Performance Analysis, but with a deeper analysis of candidate sources, reasons for disqualification, and time spent.
It also includes a monthly analysis, over the current year and the previous year.
How?
The Annual Global Analysis report allows you to see on a single screen, for all your recruiters, by month of the current year and for the previous year
- The number of open positions
- The number of candidates sourced (number of applications added manually)
- The number of spontaneous applications (number of applications automatically added by Nicoka)
- The total number of sourced candidates + spontaneous applications
- The number of candidates sourced from a Jobboard (number of applications where the candidate initially came from a job board but was added manually)
- The number of applications from a job board (number of applications where the candidate initially came from a job board that were automatically added by Nicoka or the application is recent (less than 2 months))
- The number of referrals
- The number of selected candidates (number of applications that went through a selected type stage)
- The number of candidates contacted (number of applications that went through a phone screening type stage)
- The number of candidates interviewed (number of applications that went through an interview type stage)
- The number of offers made (number of applications that went through an offer or hire type stage)
- The number of accepted and rejected offers
- The average proposal delay (in days)
- The average time to hire (in days)
- The number of disqualified candidates and associated reasons (hired elsewhere, withdrawal, no longer searching, client choice, mobility, not interested, salary, skills, ...)
- ...
Configuration
You have the option to filter by
- Recruitment process
- Missions / Mission types
- Employees / Agency
- Period
- Indicators
- Add variants to save your filters
You can
- Invert the table to have indicators in rows or columns according to your needs
- Download the table in Excel format
Source Analysis
What?
This report allows you to cross-reference application stages (in columns) with the application source and collaborator (in rows).
Thus, you can quickly determine the links between the source and the quality of applications.
How?
The Source Analysis report allows you to see on a single screen, for all your recruiters, over the current year
- The number of applications that went through each stage
- The number of disqualified candidates and the reasons
regarding the source and the project manager.

Configuration
You have the option to filter by
- Recruitment process
- Missions
- Source
- Employees / Agency
- Period
- Add variants to save your filters
You can
- Display the number of Candidates or the number of Applications
- Download the table in Excel format
Average Duration by Stage
What?
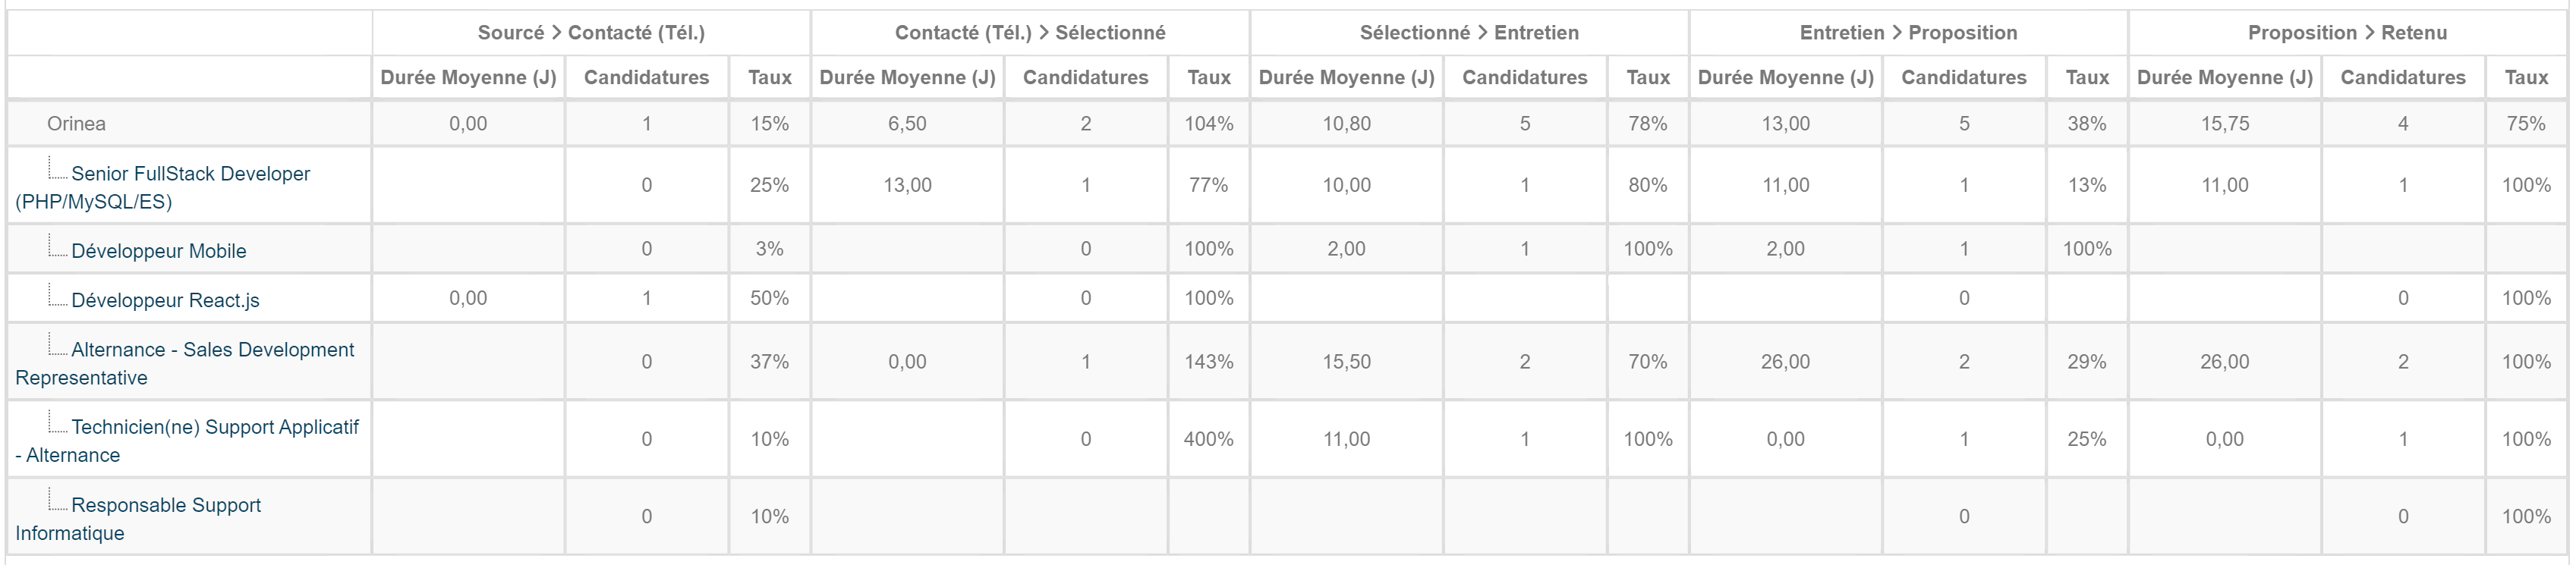
This report allows you to see, for each mission and each stage transition in your recruitment processes, the average duration, the number of applications, and the conversion rate.
Thus, you can quickly determine short and long stages, as well as potential drop-offs.
How?
The Average Duration by Stage report allows you to see on a single screen, for each mission, over the current month
- The average duration in days of a stage
- The number of applications that passed through the stage
- The conversion rate from the current stage to the next stage
Configuration
You have the option to filter by
- Recruitment process
- Missions
- Period
- Add variants to save your filters
You can
- Download the table in Excel format
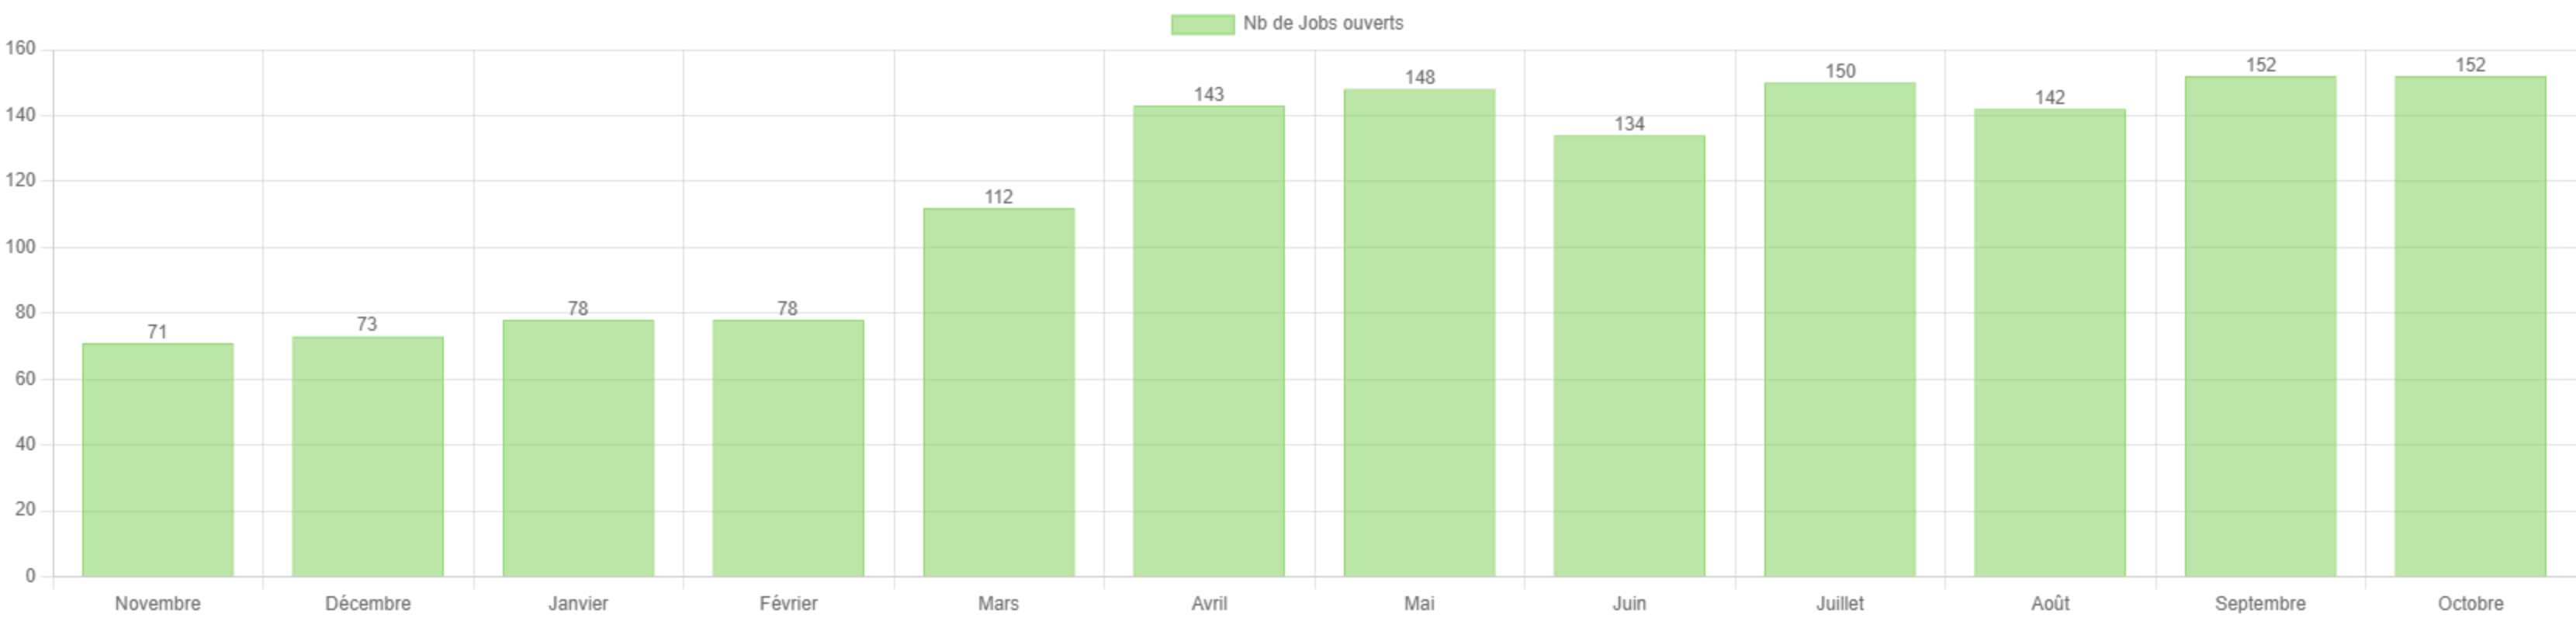
Evolution of open positions by month
What?
This report allows you to see, for each mission and each stage transition in your recruitment processes, the average duration, the number of applications, and the conversion rate.
Thus, you can quickly determine short and long stages, as well as potential drop-offs.
How?
The Average Duration by Stage report allows you to see on a single screen, for each mission, over the current month
- The average duration in days of a stage
- The number of applications that passed through the stage
- The conversion rate from the current stage to the next stage
Configuration
You have the option to filter by
- Recruitment process
- Missions
- Period
- Add variants to save your filters
You can
- Download the table in Excel format
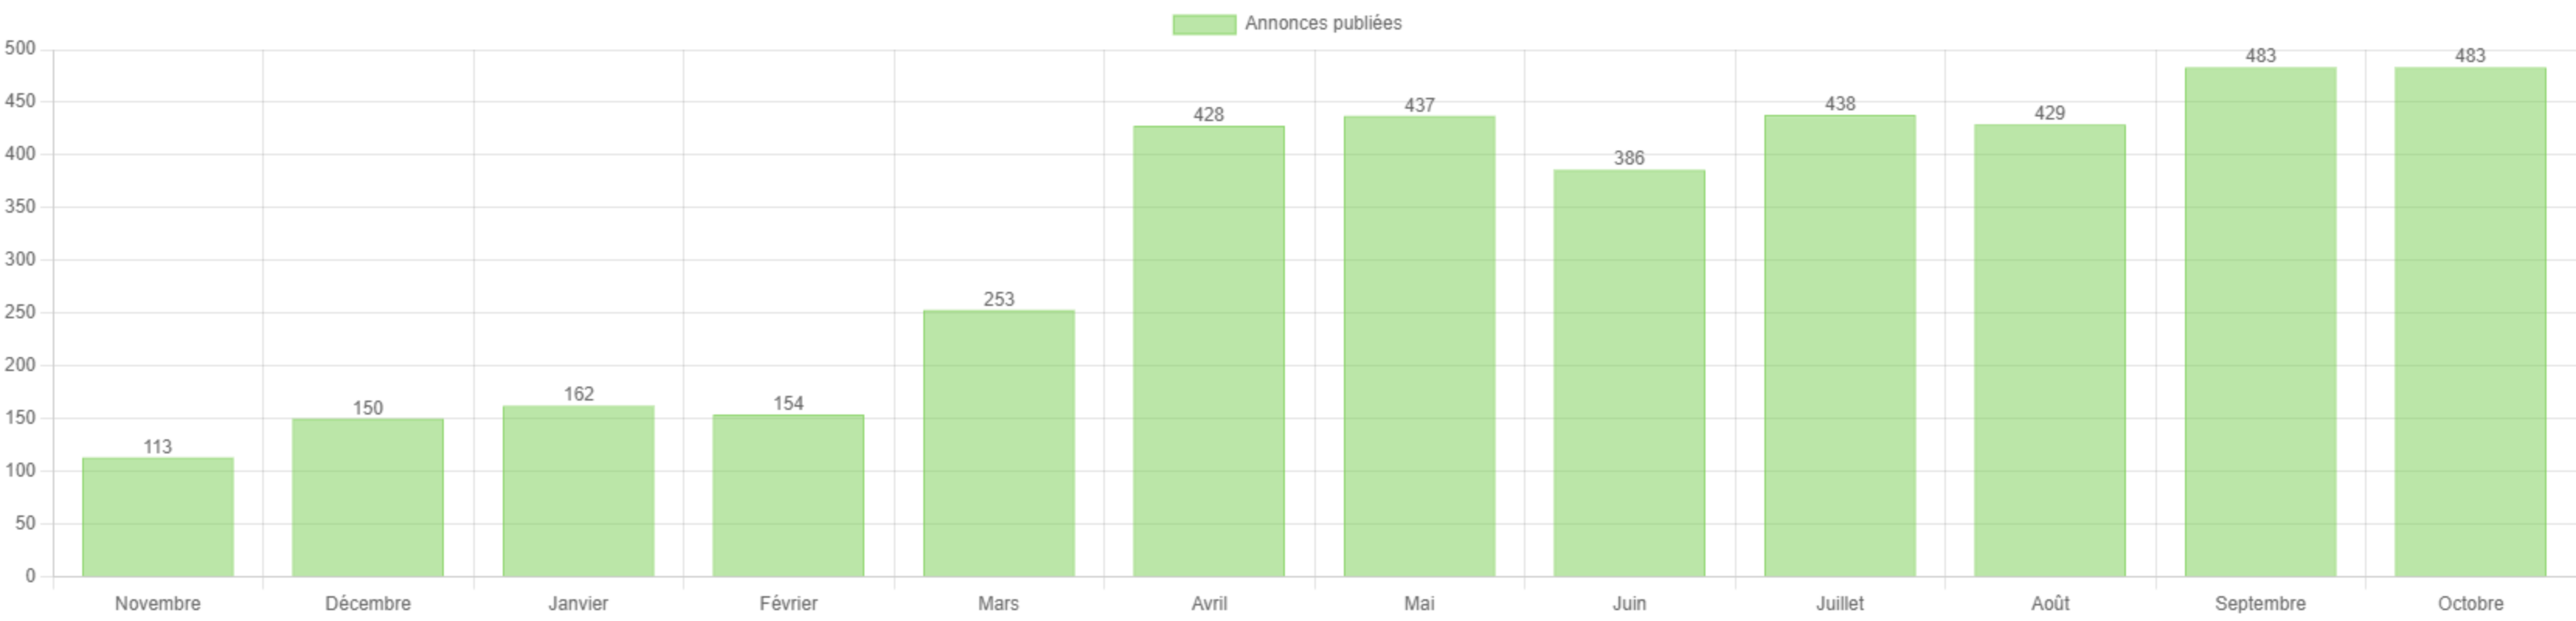
Number of ads published per month
What?
This report allows you to see the number of ads you published each.
This chart allows you to measure your activity.
How?
The report Number of ads published per month allows you to see the evolution of the number of missions over the past 12 months.
Configuration
You have the option to filter by
- Recruitment process
- Missions
- Period
- Add variants to save your filters
You can
- Download the table in Excel format
Progress Report
What?
The progress report allows you to see at a glance the current status of your ongoing recruitments.
In table format, Nicoka provides visibility on the number of candidates at each stage, disqualified or not.
For each mission, you also have the number of open positions.
How?
The Progress Report indicates for each ongoing mission:
- The reference and label of the mission
- The number of open positions
- For each stage of the recruitment process, the number of candidates in the stage or disqualified in the stage
- The total number of candidates Ongoing / Disqualified
These elements are clickable, allowing you to directly access a mission's stage.

Configuration
You can
- Modify the column display
- Download the table in Excel format
For each of your missions
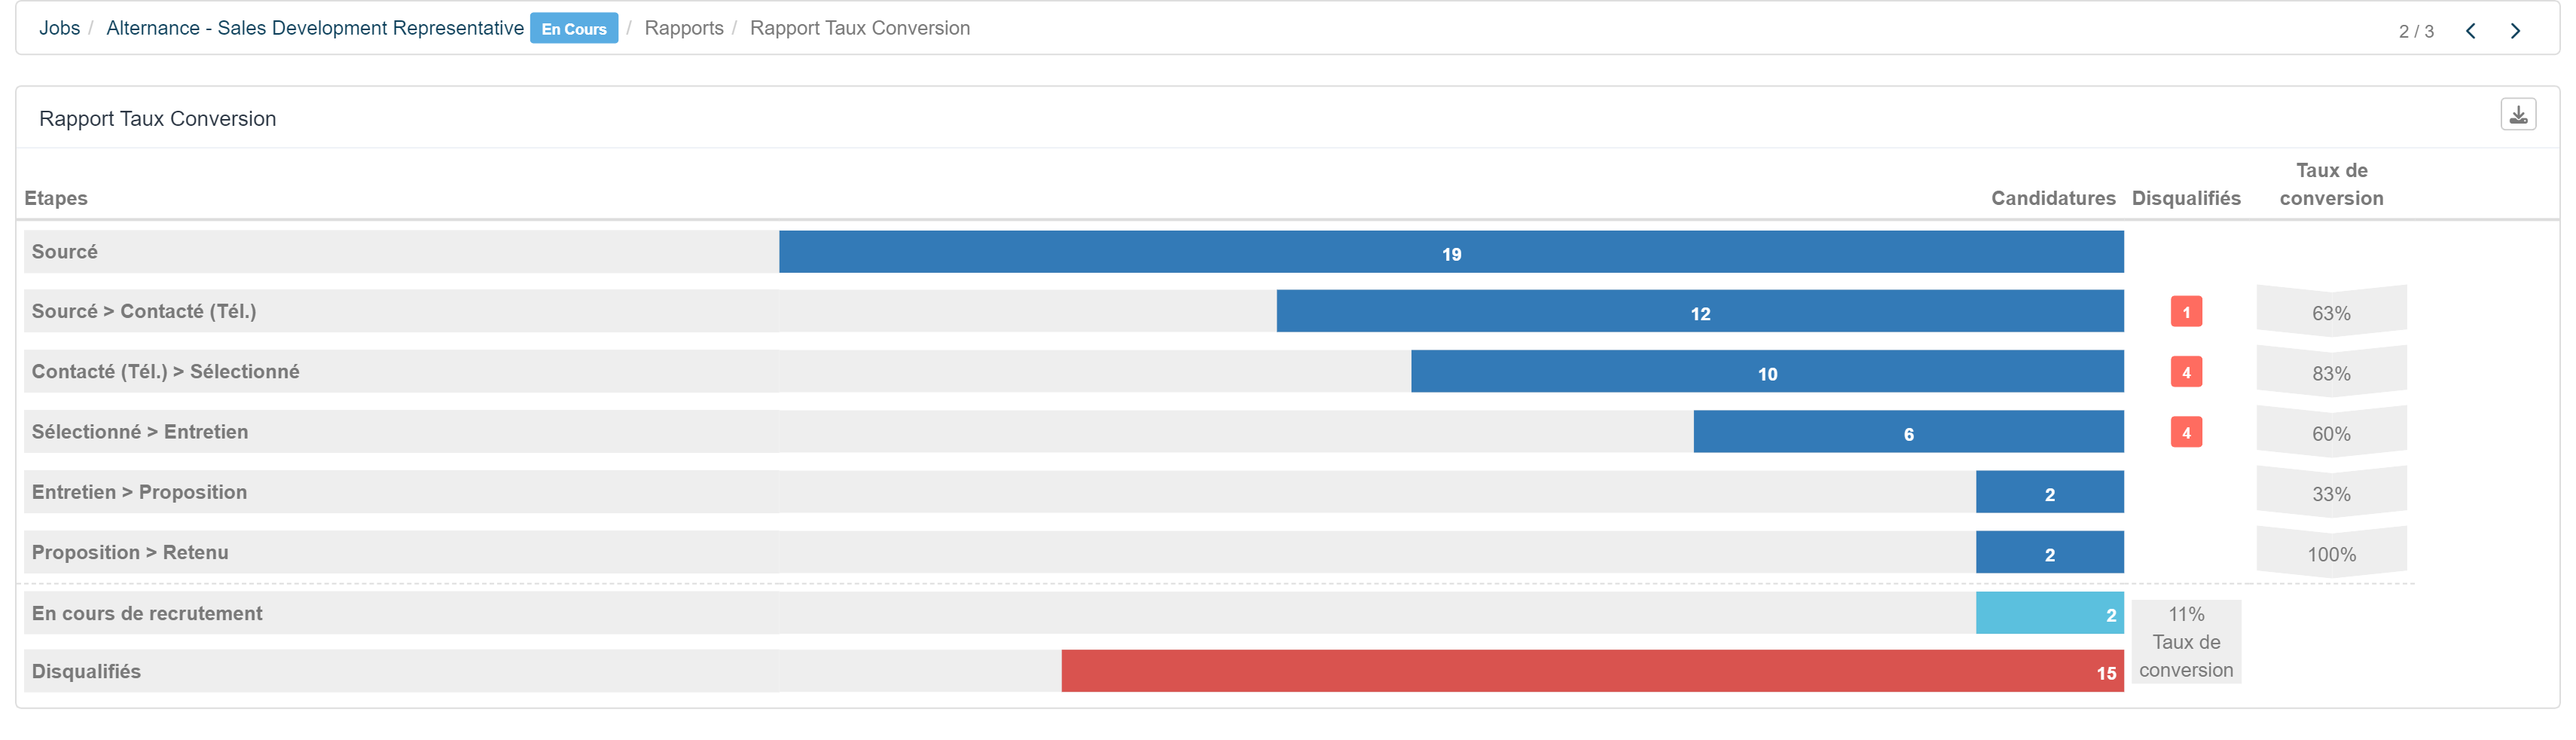
Conversion Rate Report
What?
The Conversion Rate report allows you to see at a glance the conversion rate overall and for each stage of a mission.
How?
The Conversion Rate Report indicates
- For each stage:
- The number of applications
- The number of disqualified candidates
- The Conversion Rate (Between the stage and the previous stage).
- For the mission
- The conversion rate between the number of hires and the number of sourced
Configuration
You can
- Modify the column display
- Download the table in Excel format
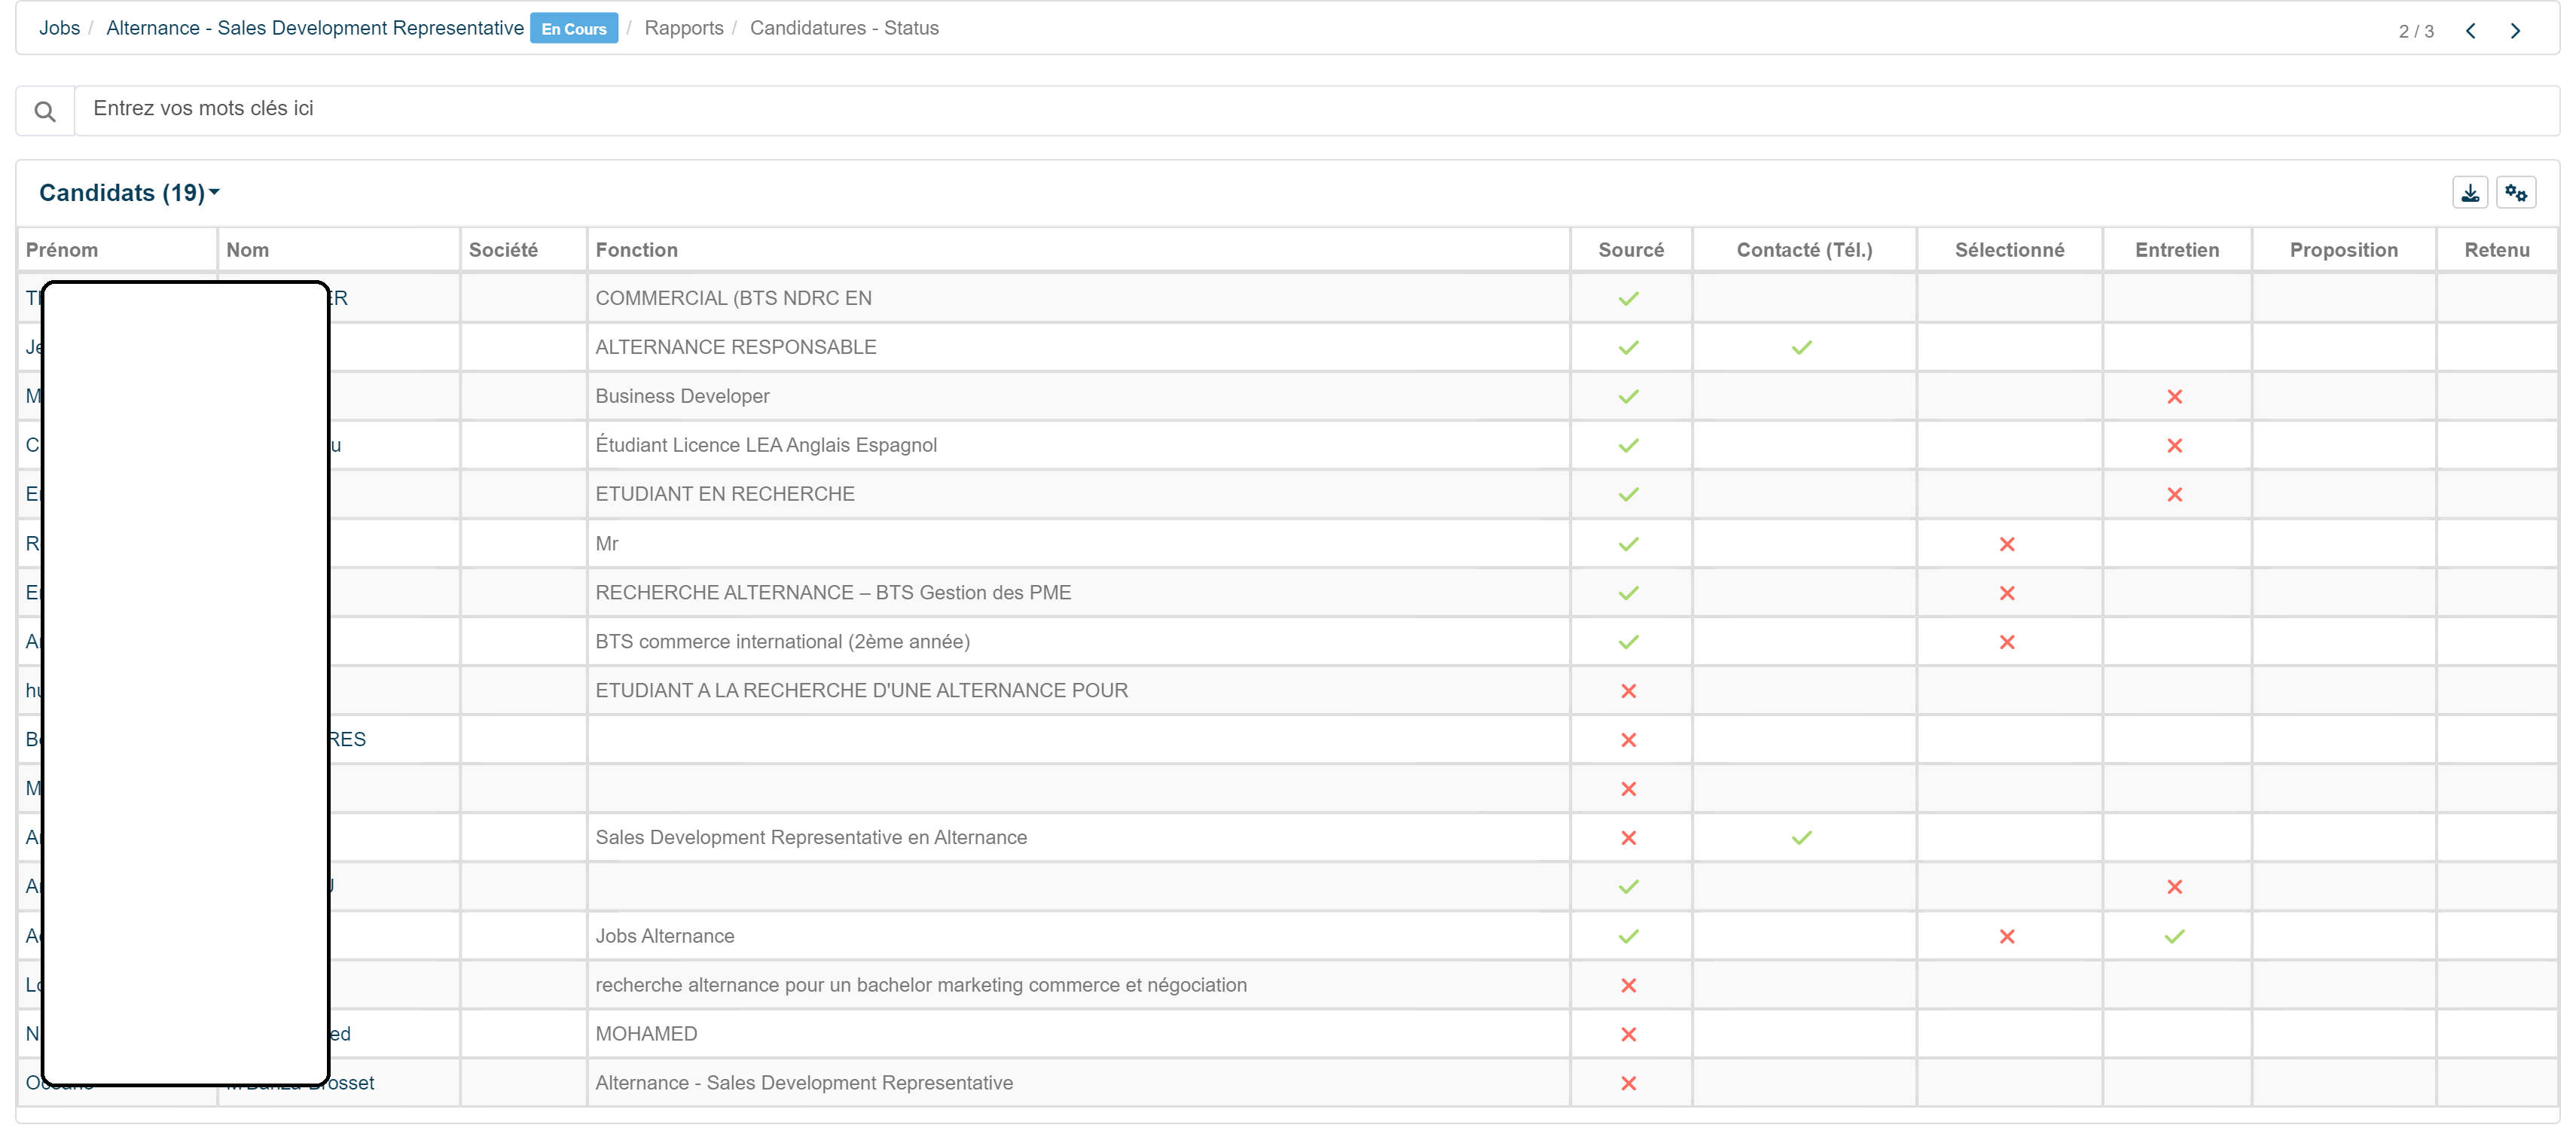
Progress Report
What?
The progress report allows you to see at a glance the current status of your mission.
In table format, Nicoka provides visibility on all candidates in the recruitment process, disqualified or not.
How?
The Progress Report indicates for the current mission:
- The list of candidates in the recruitment process
- The stages of the process
- If the candidate is in the stage or has been disqualified
Configuration
You can
- Modify the column display
- Download the table in Excel format
Your Recruitment Dashboard
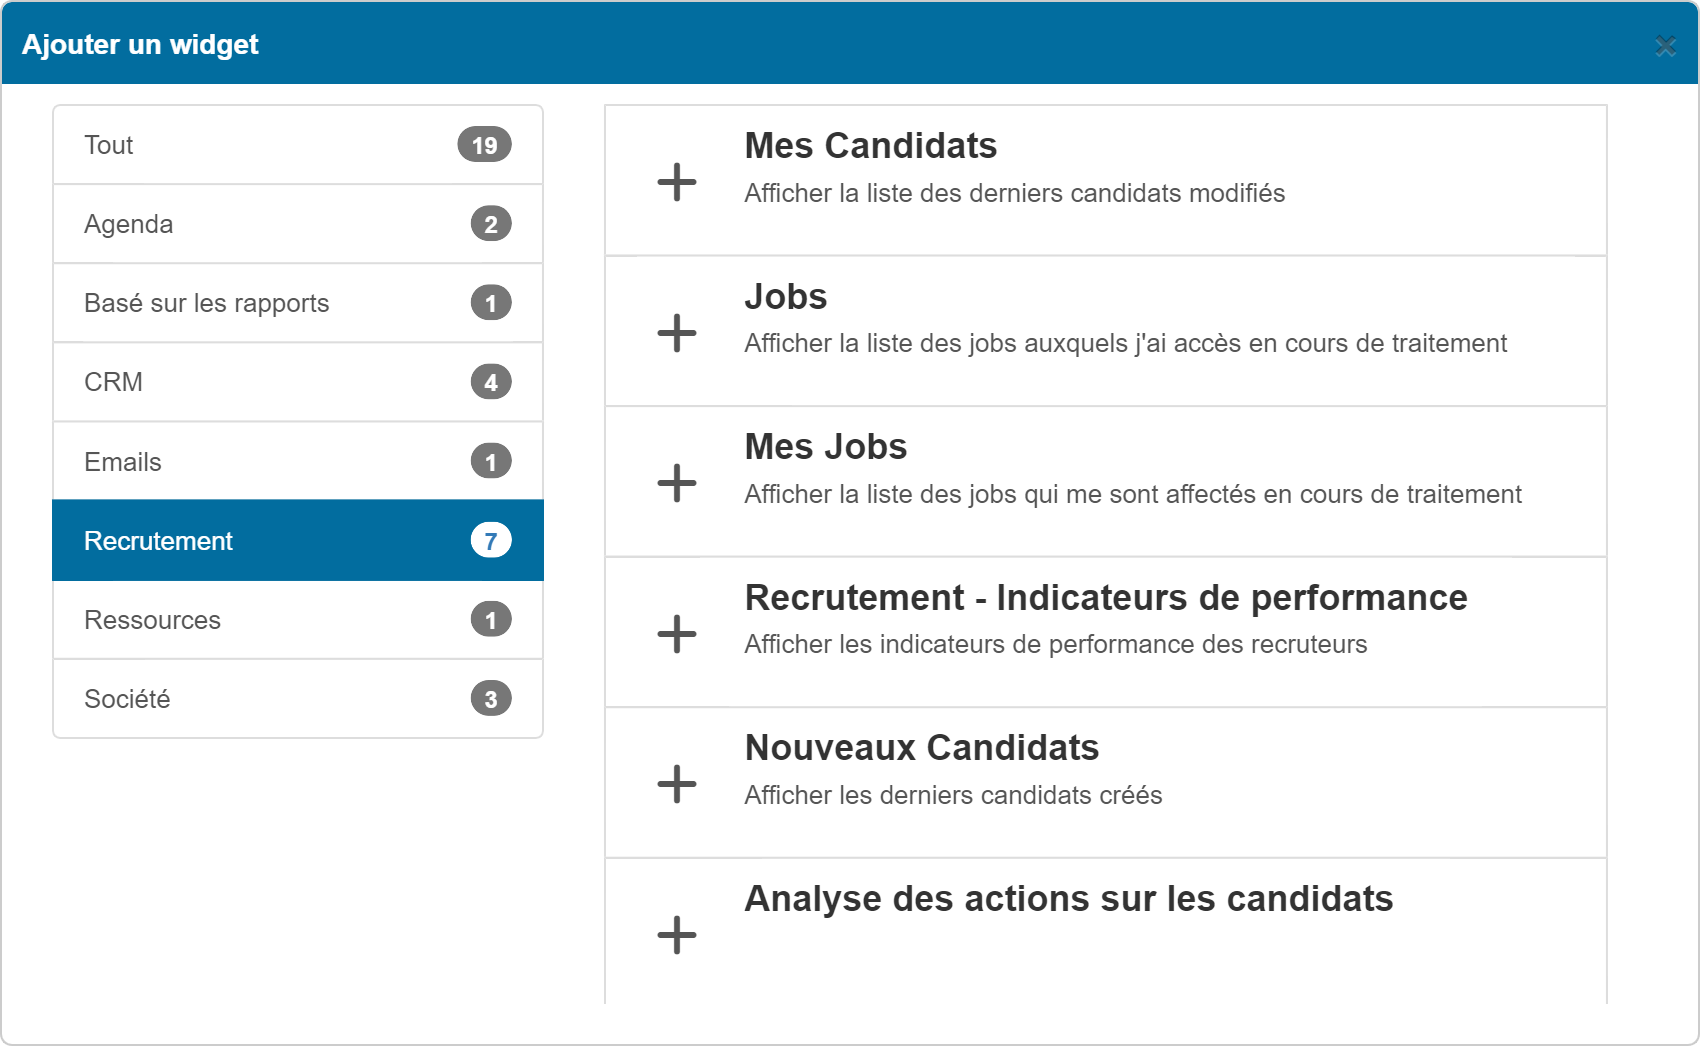
Nicoka offers several default widgets to feed your recruitment dashboard.
Among the proposed widgets, 3 allow you to track your activities in the form of reports.
- Analysis of actions on candidates
- Jobs
- Recruitment - Performance Indicators
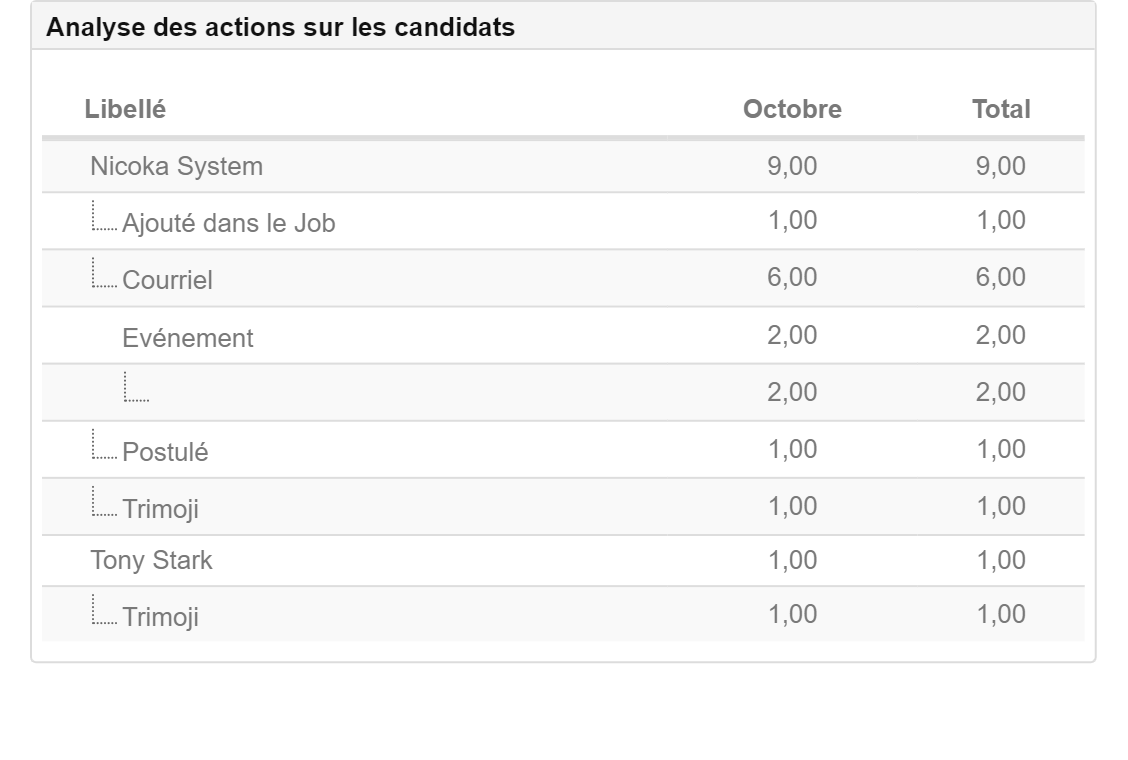
Analysis of actions on candidates
This widget allows you to quickly see all your actions (Adding to a job, mail, meeting, tests, evaluations) on all your candidates for the current month.
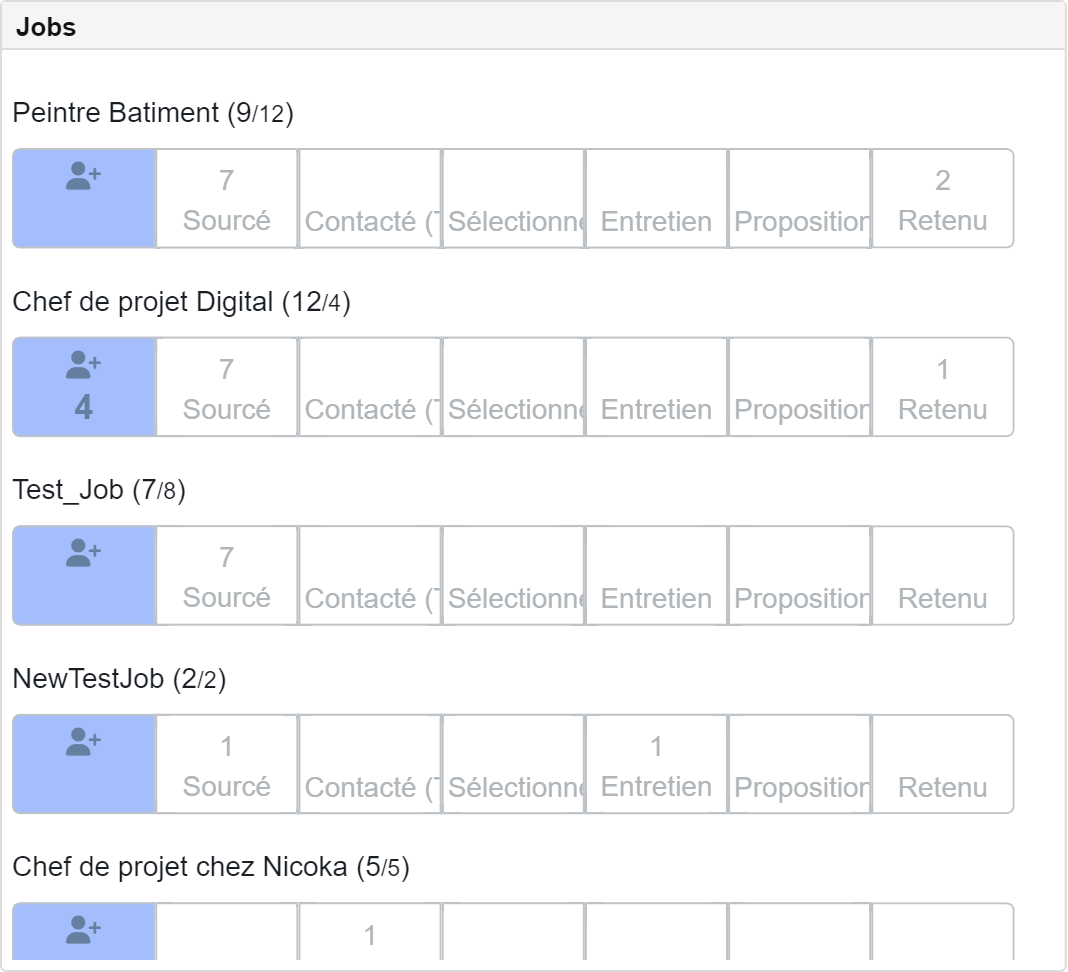
Jobs
This widget allows you to access each stage of your positions directly from your dashboard.
Recruitment - Performance Indicators
This widget allows you to find the number of candidates who have passed each stage of your recruitment process and the number of jobs created.